
Help and methods · 9
Profiles, sections and points
The line tools read the map along a line rather than over an area. Each result opens in a floating line card beside the map, which can be dragged, expanded and closed, and which stays open while point, area and buffer cards are added. A line profile reads the displayed map for the displayed day; a Hovmöller section reads the archive along a route through time, independent of the map; the measure tool gives a distance; isotherm migration compares a monthly contour across years. Points are selections like areas and buffers, each a linked card.
Line profile
Line profile takes a start and an end point and samples the displayed grid along the straight line between them: the 0.1° display grid for Temperature and Uncertainty, and the seven-day difference for 7-day change. The line is sampled at between 24 and 180 steps, about one per 8 km, the nearest cell is taken at each step, and consecutive repeats of the same cell are dropped. The horizontal axis is the great-circle distance from the start. Land and missing cells remain gaps. The card gives the observed range, the line length and the number of valid samples; its downloads and graph options export the samples and the figure.

- 1Card header with the line scope, the layer and the date.
- 2Profile chart: value against distance from the start.
Hovmöller section
Click a date inside a Hovmöller to show it on the map. Scroll over the diagram to zoom around the pointer, or drag with the hand pointer to move the visible dates. Calendar plots on other cards follow the same window; Home restores all linked plots. Navigation uses the loaded cells and keeps the section’s analysis period unchanged. See timeline controls.
- Press Hovmöller and click the start and the end of the section. Typed coordinates work in the same way. Repeat to accumulate up to four sections, labelled H1 onwards. Close a section to free a slot; its neighbours remain unchanged.
- The route is chosen automatically and the section is built for the default settings: SST over the two years ending on the latest available day for the selected SST product.
- Open Section settings to change the route, the buffer, the variable, the window or the end date, then press Update section. Drag the bottom handle or enlarge the card for a taller diagram; its width stays the same as other result cards.
Use Add Hovmöller above the cards to draw another section. Arrange places all open cards over the map; Dock cards puts them in the scrolling card collection. These controls also work when only Hovmöllers are open. Each section retains its own product, dates, route, buffer, variable and completed result through layout changes. The map shows a labelled route for each section. Changing the map’s SST product applies to new sections; existing cards retain the product shown in their context line.
The section reads its product’s native archive cube on the server (0.05° OSTIA or 0.25° OISST) and is independent of the displayed layer and date. Three routes exist. A straight section between the two points is snapped to a zonal line at the mean latitude when it lies within 10° of east–west, to a meridional line at the mean longitude when within 10° of north–south, and is otherwise oblique; it is sampled at up to 400 nearest cells with consecutive duplicates removed, and its axis is longitude, latitude or distance accordingly. A coastal section follows the coast between the two points, as the coastal buffer does, sampling cells within the chosen offshore buffer and labelling the axis in distance along the coast. Automatic chooses the coastal route when both endpoints lie within 25 km of the same coastline and are at least 10 km apart, and the straight route otherwise.
The variable is SST, on the fixed 10 to 29 °C scale, or the SST anomaly against the 1991–2020 heatwave3 day-of-year climatology, on the ±5 °C scale. The window is one, two, five or ten years ending on the chosen end date, which must keep the whole window inside the archive. Time runs along the horizontal axis with year ticks; the vertical axis is the route position, both titled with their units. The time axis is a regular daily calendar, so a source-absent day is a blank column, and no value is interpolated in either direction. A request beyond 1.5 million samples is refused with a message to shorten the window or the section.

- 1Section settings opens the route, buffer, variable and date controls.
- 2The complete diagram and legend fit within the initial card.


Measure
Measure takes two points and reports the great-circle distance between them on a sphere of mean radius 6,371.0088 km, to two decimals below 10 km and to one decimal otherwise, together with the two coordinates.

Isotherm migration
Isotherm migration, under Spatial change in the left workspace, draws the contour of a chosen monthly-mean temperature (15, 18, 20, 23 or 26 °C, 20 °C by default) for a chosen month in each year, so that a poleward or equatorward displacement over the years can be seen on the map. A month enters only with at least 90% of its days observed, and nothing is interpolated. It is a visual counterpart of warming, not a fitted trend.

Histogram
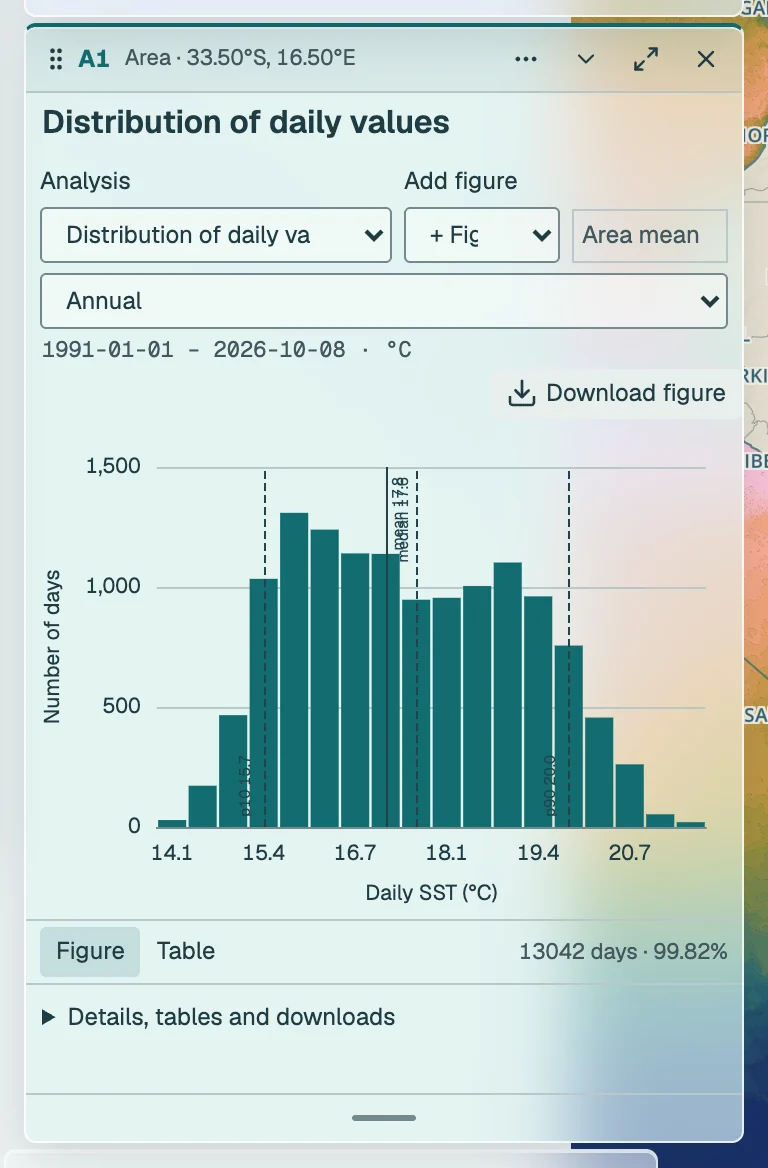
Distribution of daily values is a method on every card, under What are the conditions?. It bins the selection’s daily values over the analysis interval into equal widths between the observed minimum and maximum, with the bin count the square root of the day count held between 8 and 18, and marks the mean and median. For an area or buffer each day is already the cell-area-weighted mean, so the histogram describes time, not space. Missing days are left out, never filled.
Linked point analyses
Every point click after Point adds a compact point card. Choose 1, 4 or 16 native native pixels (0.05° OSTIA or 0.25° OISST), displayed as a fixed 1×1, 2×2 or 4×4 footprint. Temperatures use a spherical-cell-area-weighted mean with at least 90% of the fixed ocean area present. Land and missing cells are never replaced by a different ocean location.
Choose a question and a method on the card. Linked cards share the method and its scientific settings unless independent analyses are enabled.
What are the conditions?
Start with the observed temperature, its departure from the fixed 1991–2020 seasonal baseline, or the usual annual cycle. Missing observations remain gaps.
Seasonal cycle · Summary of conditions and change · Daily SST series · SST anomaly series · Distribution of daily values · Seven-day change · Uncertainty. Example figure · Method details
How has it changed gradually?
Compare the direction, rate and timing of change. Annual fits use complete calendar years with at least 90% daily coverage. A fitted pattern does not identify its cause.
Decadal SST trend · Quantile regression (quintile bands) · GAM and periods of warming / cooling · Robust trend and Mann–Kendall · Sensitivity to start and end years · Time of emergence · Warming stripes · Cumulative SST anomaly (CUSUM). Example figure · Method details
Did it change abruptly?
Test whether levels or slopes changed. A selected breakpoint is a statistical candidate. Correlated variation, endpoint choice and the minimum segment length can affect it.
Multiple shifts in mean or variance (PELT) · Single shift (Pettitt) · Sequential regime shifts (STARS) · One change in slope · Multiple changes in slope (Bai–Perron). Example figure · Method details
Is the seasonal cycle shifting?
Compare the timing, size and duration of the annual temperature cycle. Threshold-based seasons depend on the chosen temperature; this never changes the operational 1991–2020 event baseline.
Seasonal amplitude and timing · Warm-season onset, end and length · Compare climatological cycles · Thermal-envelope explorer. Example figure · Method details
Is it becoming more variable or persistent?
Look beyond the mean: spread, memory and recurring periods answer different questions. These analyses use daily anomalies against the fixed seasonal baseline. Missing dates are never interpolated.
Changes in temperature variability · Persistence and decorrelation time · Recurring periods and wavelets · Climate-mode context (one index: ENSO, IOD or SAM). Example figure · Method details
How do extremes behave?
Events are detected in the full record. Metric trends assign whole events by peak date. Years without an event are zero for counts and missing for mean event intensity or duration. A regional event is detected in the area-mean SST, not a count of grid-cell events. Area occupancy instead measures the ocean area covered by native-cell event categories.
Marine heatwaves · Marine cold-spells · Area occupied by MHWs / MCSs · Rapid extreme thermal transitions · Trends in event metrics · Trends in event counts or days · Accumulated heat stress (DHW map). Example figure · Method details
What was the wind?
ERA5 reanalysis 10 m wind over the South African box (11–38.5°E, 40–22°S), 1991 onward, against its 1991–2020 day-of-year climatology. Stress uses the Large and Pond (1981) bulk formula on hourly wind; curl is least reliable within a cell or two of the coast. The wind reaches the tracker about five days behind real time. Place a wind figure under an SST figure to read the two together; a lagged relationship is a description, not attribution.
Wind rose (ERA5) · Daily wind speed (ERA5) · Daily wind stress (ERA5) · Daily wind stress curl (ERA5) · Wind speed trend (ERA5) · Wind stress trend (ERA5) · Wind stress curl trend (ERA5). Example figure · Method details
How do two selections compare?
Keep the spatial support, years and method explicit. Paired slope differences use common years and retain the dependence between selections. Comparing periods answers a different question from comparing slopes.
Compare two time periods · Compare two selections’ trends · Compare areas side by side · Compare maps and dates. Example figure · Method details
The shared interval applies to the linked point, area and buffer cards; incomplete calendar years are excluded from annual fits. Expand a card for its main figure, selectable additional figures, method settings and display layers. Detailed statistics, data and provenance are collapsed below. Chart comparison & downloads includes the paired trend-difference test for two selected cards. Arrange, Minimise all and Dock cards include the open line-tool card and keep the map accessible while markers stay linked. Hovmöller and other line tools retain their own dates and settings.
For multiple pixels, the uncertainty line is a conservative upper bound formed from weighted source standard errors under perfect positive correlation. It is not an independence-based standard error or confidence interval. Unarchived uncertainty stays unavailable. Save analysis reconstructs the full point group, its exact footprints, fixed interval and per-card settings.