
Help and methods · 3
Data, dates and status
Choose OSTIA (UK Met Office, distributed by NASA PO.DAAC) or NOAA OISST v2.1 under Layer settings. Each SST product has its own native grid, archive, latest available date and 1991–2020 baseline. Wind and sea-level observations are separate sources.
The source record
| Product | Period used | Role |
|---|---|---|
| OSTIA reprocessed (REP) v2.0 | 1 January 1982 to 31 December 2023 | Baseline and archive; the climatology uses this product only |
| OSTIA near-real-time (NRT) v2.0 | 1 January 2024 onwards (an overlap year, 2023, is kept for comparison and not merged) | Operational continuation of the archive |
| NOAA OISST v2.1, AVHRR-only | 1 September 1981 onwards | Independent 0.25° SST archive and its own 1991–2020 baseline |
OSTIA has a 0.05° native grid; OISST has a 0.25° native grid. Both cover the SAOCE domain, 26°W to 60°E and 50°S to 51°N. SST cursor readings, hover previews, cards and sections identify the selected product and its native support. Line profiles sample the displayed layer grid, whose resolution can differ from the analysis archive.
REP and NRT are distinct source products. Their 2023 overlap was checked across all seven LMEs: area-weighted mean NRT minus REP differences range from −0.233°C to +0.107°C, with cell-day root-mean-square differences of 0.245–0.425°C. No bias correction or blending is applied. Interpret long-term trends and changes across January 2024 with this product change in mind.
The climatological baseline is the World Meteorological Organization standard normal 1991 to 2020. It is computed separately for each SST product. OSTIA uses its reprocessed record; OISST uses its own 1991–2020 observations. Anomalies, event thresholds and warming stripes use the matching product baseline. NOAA’s supplied anomaly field, which uses a different baseline, is not used.
The maps preserve the source’s finite-water coverage, which can include inland lakes. Area analyses and spatial occupancy use the documented ocean mask and observed-area coverage checks. The seven LME boundaries define marine reporting regions. Thermal phenology retains an explicitly labelled July–June analysis year; it is not a validated Northern Hemisphere or tropical ecological-season definition. Use the seasonal cycle to inspect local timing before interpreting that specialised method.
Days without data
A day for which the provider has no file is absent from the archive. It is never interpolated, padded or replaced by a neighbouring day, and the event-detection code runs with its padding length set to zero. The one exception lies inside the climatology: for the 29 February slot of non-leap years heatwave3 takes the mean of 28 February and 1 March before pooling the climatology window (the heatwaveR convention), so that every day of year draws on the same number of years; the daily product itself is untouched. The consequence is visible throughout: a missing day is a gap in a series, a blank column in a Hovmöller section, a null in a table and a missing row in an export. Annual statistics require at least 90 per cent of the year’s days; a year below that is reported as unavailable rather than estimated.
On 11 October 2026 the OSTIA archive held 16,331 of the 16,354 days since 1 January 1982. The 23 absent days fall in six provider gaps after the operational cutover. The operations page lists them, and every card footer states the observed days of its interval and their share of the calendar days.
When the provider has not published the newest days, a notice below the top bar names the missing days and, where the provider has issued an alert, links to it. The map and every analysis end on the latest published day. This is a provider problem that SAOCE cannot influence. The days are added automatically once the provider publishes them, and the notice clears itself. The missing days are counted up to the previous day (UTC) on every visit, so the notice stays current between daily runs, and dismissing it hides it only for the rest of the day. Data status in the top bar repeats the notice. A failure of SAOCE’s own processing never opens a provider gap notice; an open notice stays until a run completes.
The daily update
The OSTIA update starts daily at 09:30 SAST for the entire domain. It downloads any days that have appeared in a ten-day look-back window, appends them to the analysis cube, extends the event classification over the recent tail, refreshes the regional analyses and rolling-year blob catalogue, and publishes matching SST and MHW/MCS map dates for all seven LMEs together. Any failed SST stage retains the last successful map publication. Processing completion time can vary with source availability. OISST has a separate daily update at 11:00 SAST and can lag OSTIA. The header reports the latest date actually held by the selected product, rather than assuming that both are equally current.
Each release carries the eight most recent days as map images, the daily domain statistics, and a catalogue of event maps covering the last 92 days. Earlier days remain available through the calendar. Historical SST maps are rendered from the archive on request; historical MHW/MCS maps are rendered from the stored daily event categories.
Stable and provisional event days
An event needs at least five days above threshold, and two exceedances separated by a gap of at most two days are joined. A classification for the most recent seven days can therefore still change when the next days arrive. The interface calls the last day whose classification can no longer change the stable through date. Later days are shown, labelled provisional, and are kept out of annual summaries; the timeline marks the boundary.
Choosing a date
The timeline spans the whole archive: drag to preview a date and release to load it. Day detail lists the published days of the current release as buttons. Map date opens the archive calendar, whose range depends on the layer: the full archive for SST and the anomaly, the analysed event archive for the heatwave and cold-spell layers, and the eight-day release for the uncertainty layer. Choosing a date checks it against the availability record before the map changes, so a source-absent day is reported and no substitute is drawn. The map date and the analysis interval of the cards are independent.


Click a date within a card’s calendar plot, including a Hovmöller diagram, to request that day on the map. The current daily layer and SST product remain selected. A fixed-period layer changes to daily SST with a notice. Missing dates leave the last complete map visible. See chart timeline controls.
Where the status is reported
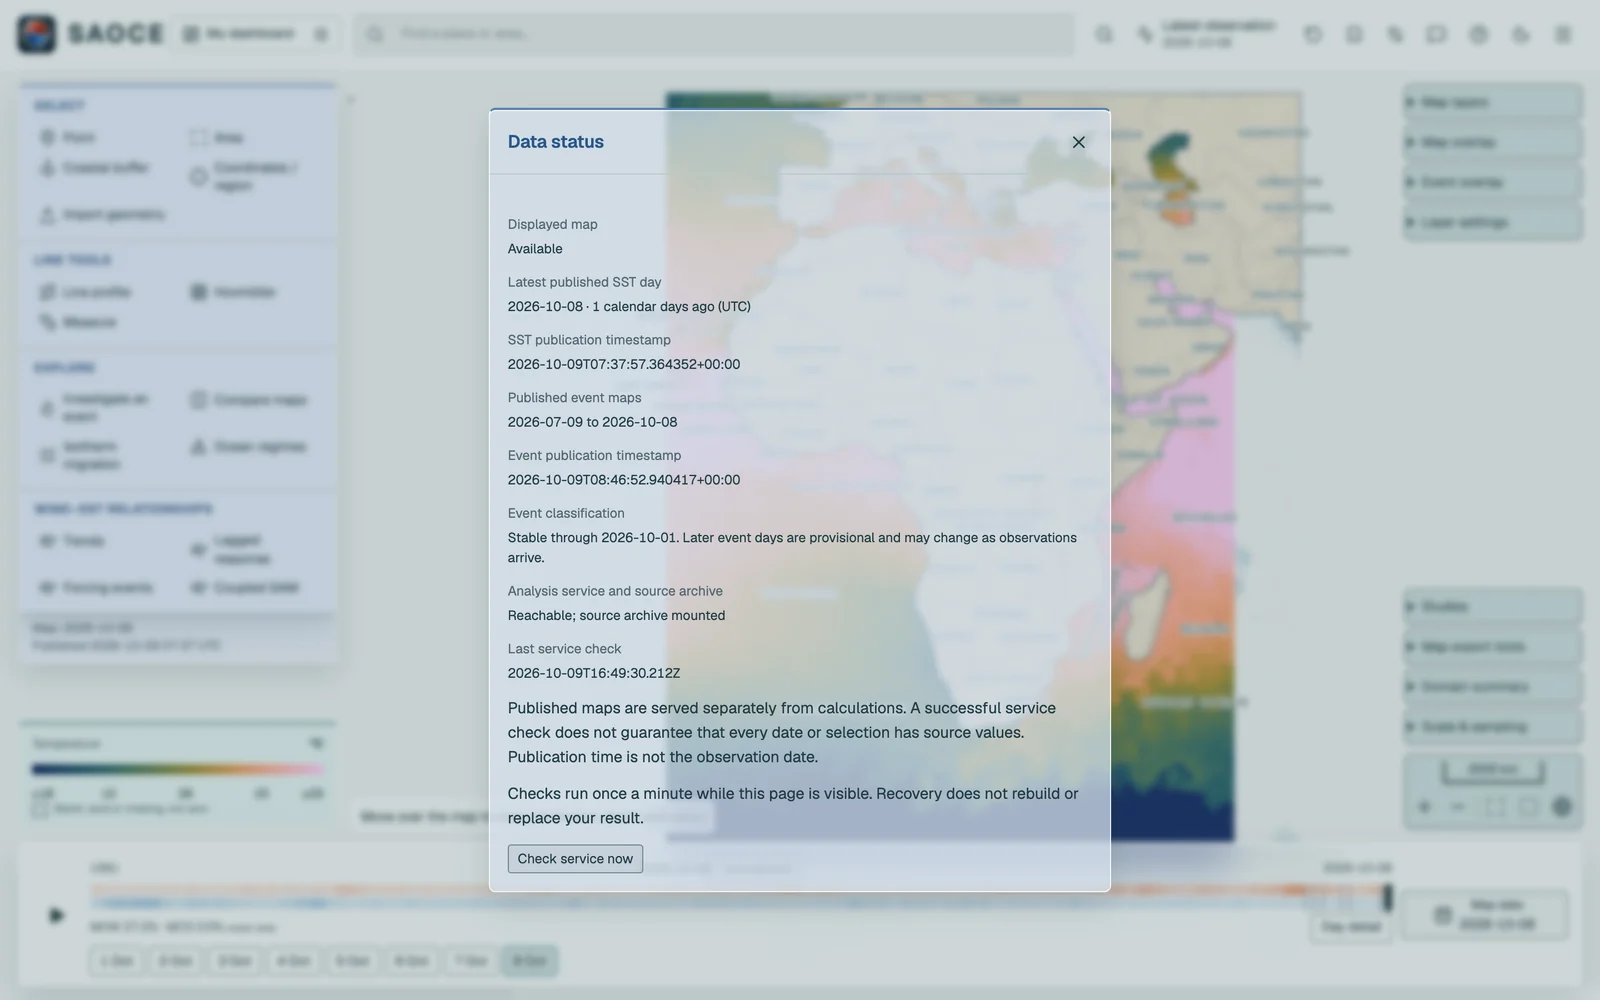
The header badge prominently names the active SST product, native resolution and latest server date. It opens the Data status sheet, the first place to look when a date seems old: it gives the latest published SST day and its age in days, the timestamps of the last SST and event publications, the stable-through date and the result of the latest service check.
Connection, analysis readiness and data age are separate checks. An older SST date does not by itself mean that the server is down, and a reachable server may still be preparing its analysis service. If a map update fails, the previous complete map remains visible with its date. Check the message before retrying; a calculation may still be running after its connection is interrupted.
The Operations page gives authorised operators the full picture of the archive: coverage of the reprocessed and near-real-time products, the last download and its result, the stage of the daily processing, storage, diagnostics, provider gap periods, a file inventory and the recent runs.
How the layers use these dates is described under Map layers.