
Help and methods · 2
The interface
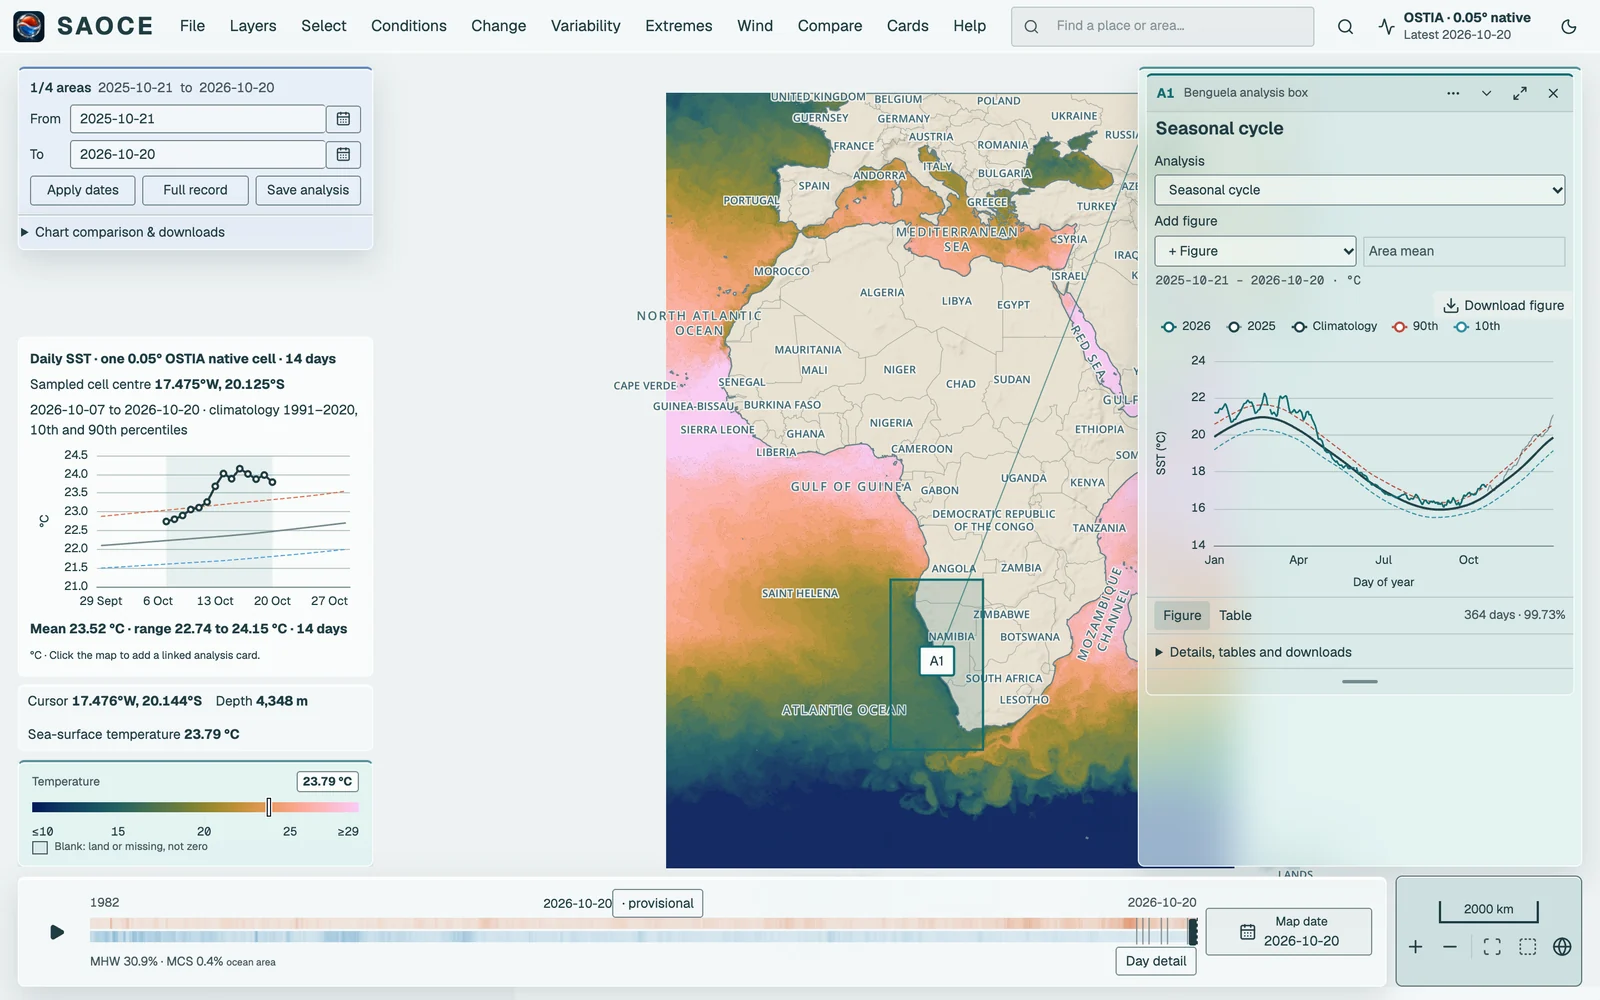
One screen holds everything. The menu bar along the top holds every action, grouped by task. The left column holds the dates of your selection and Chart comparison & downloads at the top, and the hover preview, cursor readout and legend at the foot. The right column holds the docked result cards. Along the bottom, the timeline sits beside the map navigation. This page names each part; the following pages describe what the parts do. Adding ?shell=classic to the address shows the earlier layout, with the tool panel on the left and the control boxes on the right.
First visit
A first visit opens on a welcome screen with an animated field of mean surface currents. The currents come from the NOAA Global Drifter Program annual mean near-surface field (version 3.10, observations through February 2023); the motion is accelerated and the colours are decorative, as the disclosure under the animation states. Explore the maps enters the map, and the choice is remembered in the browser. Adding ?welcome=1 to the address shows the screen again, and the About dialogue offers a link to revisit it.

After entering the map for the first time, the six-step Quick start guide introduces the Benguela example, map navigation, points, areas, coastal buffers, combining selections and choosing results. Use Next and Back, or Skip guide at any step. Completion and dismissal are remembered in this browser. Reopen it under Help → Quick start guide, or search for it in command search.
Menu bar and header
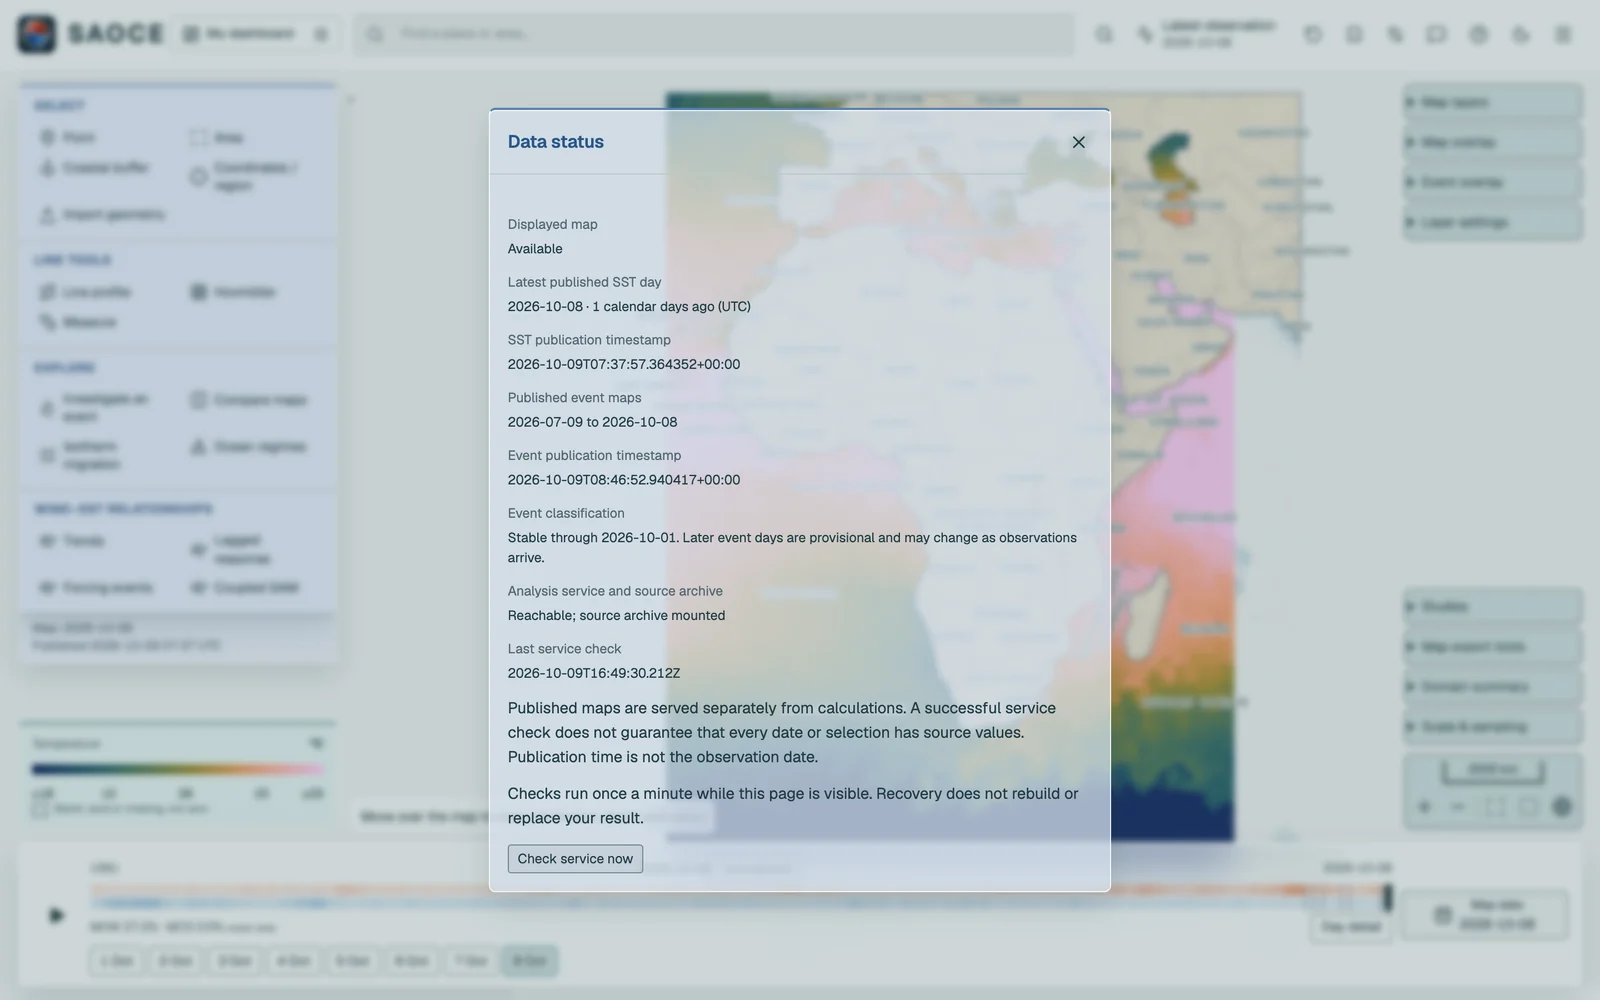
From left to right: the SAOCE logo, the menu bar, place search, command search, the Latest observation status and the theme toggle. Place search locates a place or a reporting area and moves the camera; it does not create a selection. Below a window width of 1280 px it moves into command search, which also finds places. Latest observation names the newest published day and opens the Data status sheet. Menus open on a click or tap; once one is open, moving the pointer along the bar opens its neighbours, and the arrow keys and Escape work as in a desktop application.
| Menu | Contents |
|---|---|
| File | My dashboard, Edit dashboard, Reset workspace, Saved work, Named views, map image and data export, the download and share links, and Setup (text size and personal overlays) |
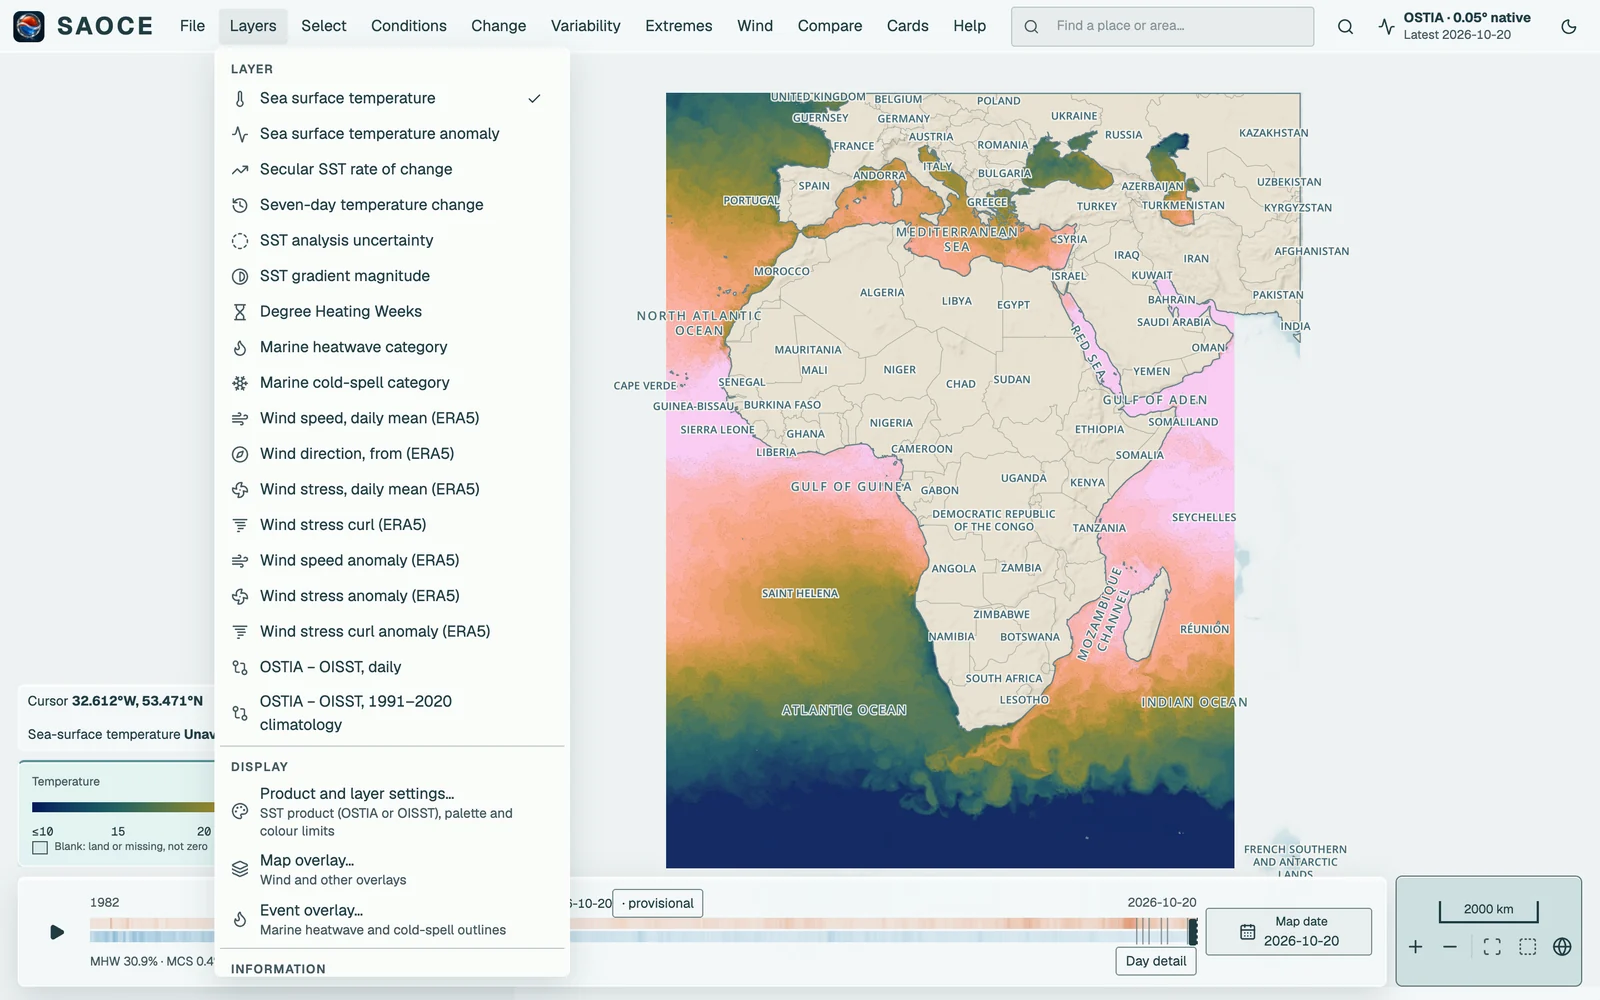
| Layers | The nine map layers, the displayed one ticked; Product and layer settings, Map overlay and Event overlay; Domain summary and Scale and sampling |
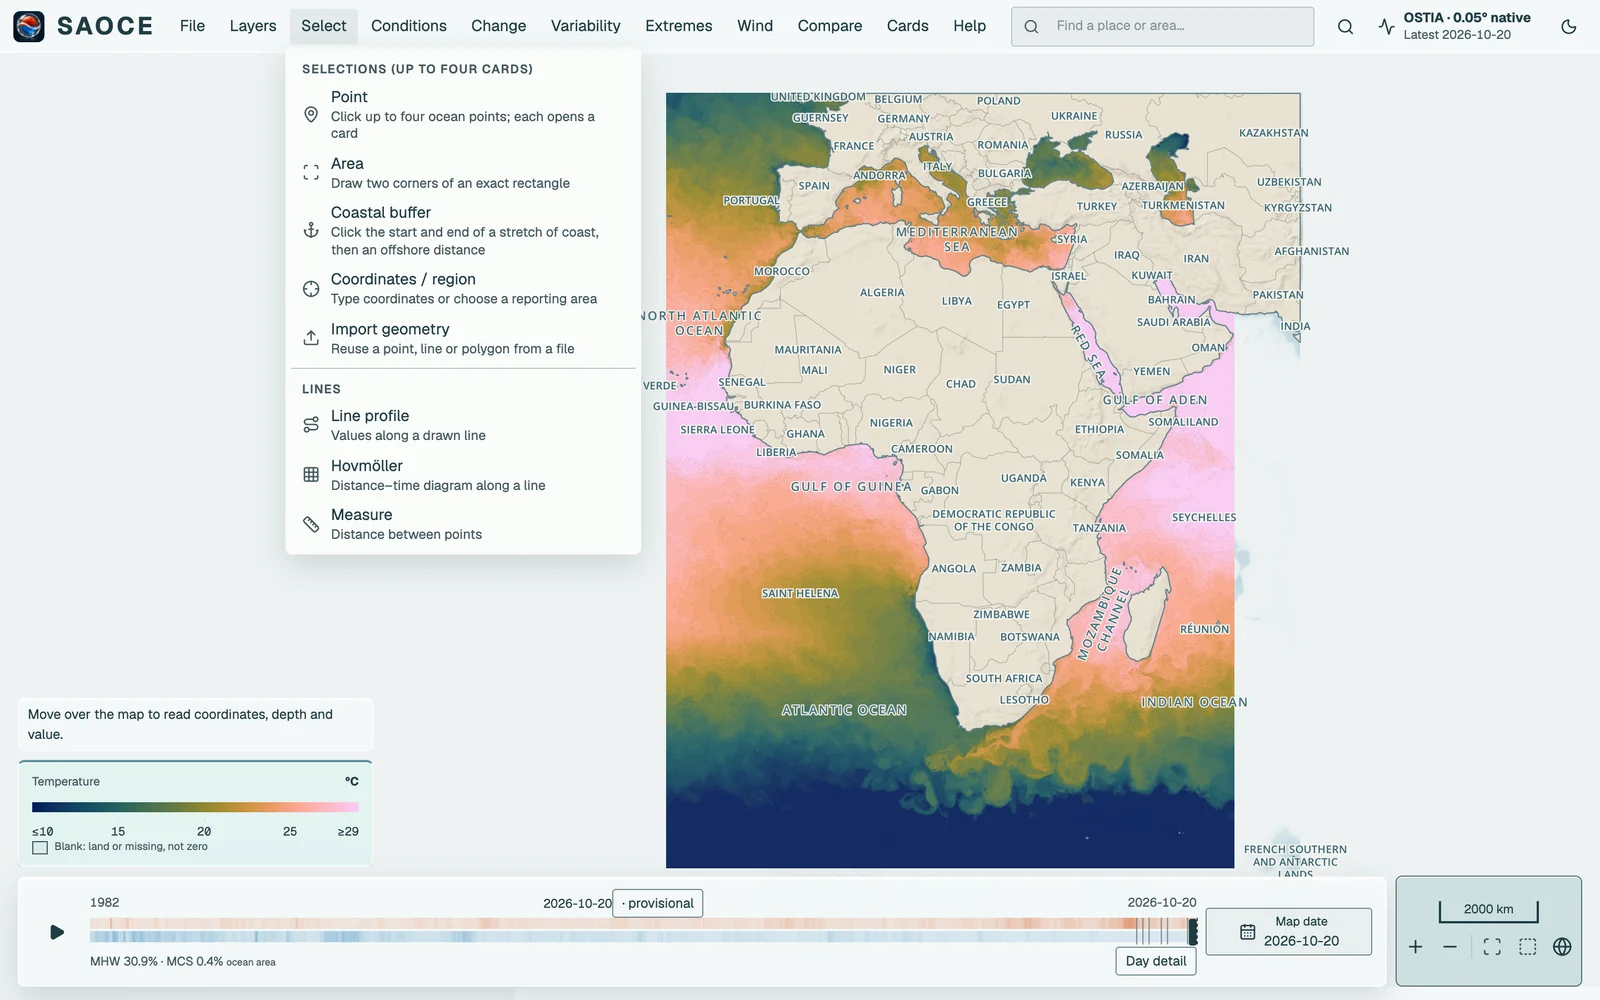
| Select | Point, Area, Coastal buffer, Coordinates / region and Import geometry; the line tools Line profile, Hovmöller and Measure |
| Conditions, Change, Variability, Extremes, Wind, Compare | The analysis methods, grouped by the question they answer, with the related map tools: Ocean regimes, Isotherm migration, Agulhas front, Investigate an event, the Wind–SST relationships and Compare maps and dates. A method applies to the open cards or, with none, to the next selection. |
| Cards | Arrange cards, Minimise all, Dock cards and Close all cards |
| Help | Keyboard shortcuts, Quick start guide, Studies, the help pages, NEWS, About and feedback |
File → Reset workspace starts a fresh workspace on the latest SST map over the full domain, clearing open cards, selections and comparisons; named saved analyses survive it. Cards → Close all cards removes every card but keeps the layer, the date and the map view; saved work reopens from File → Saved work.
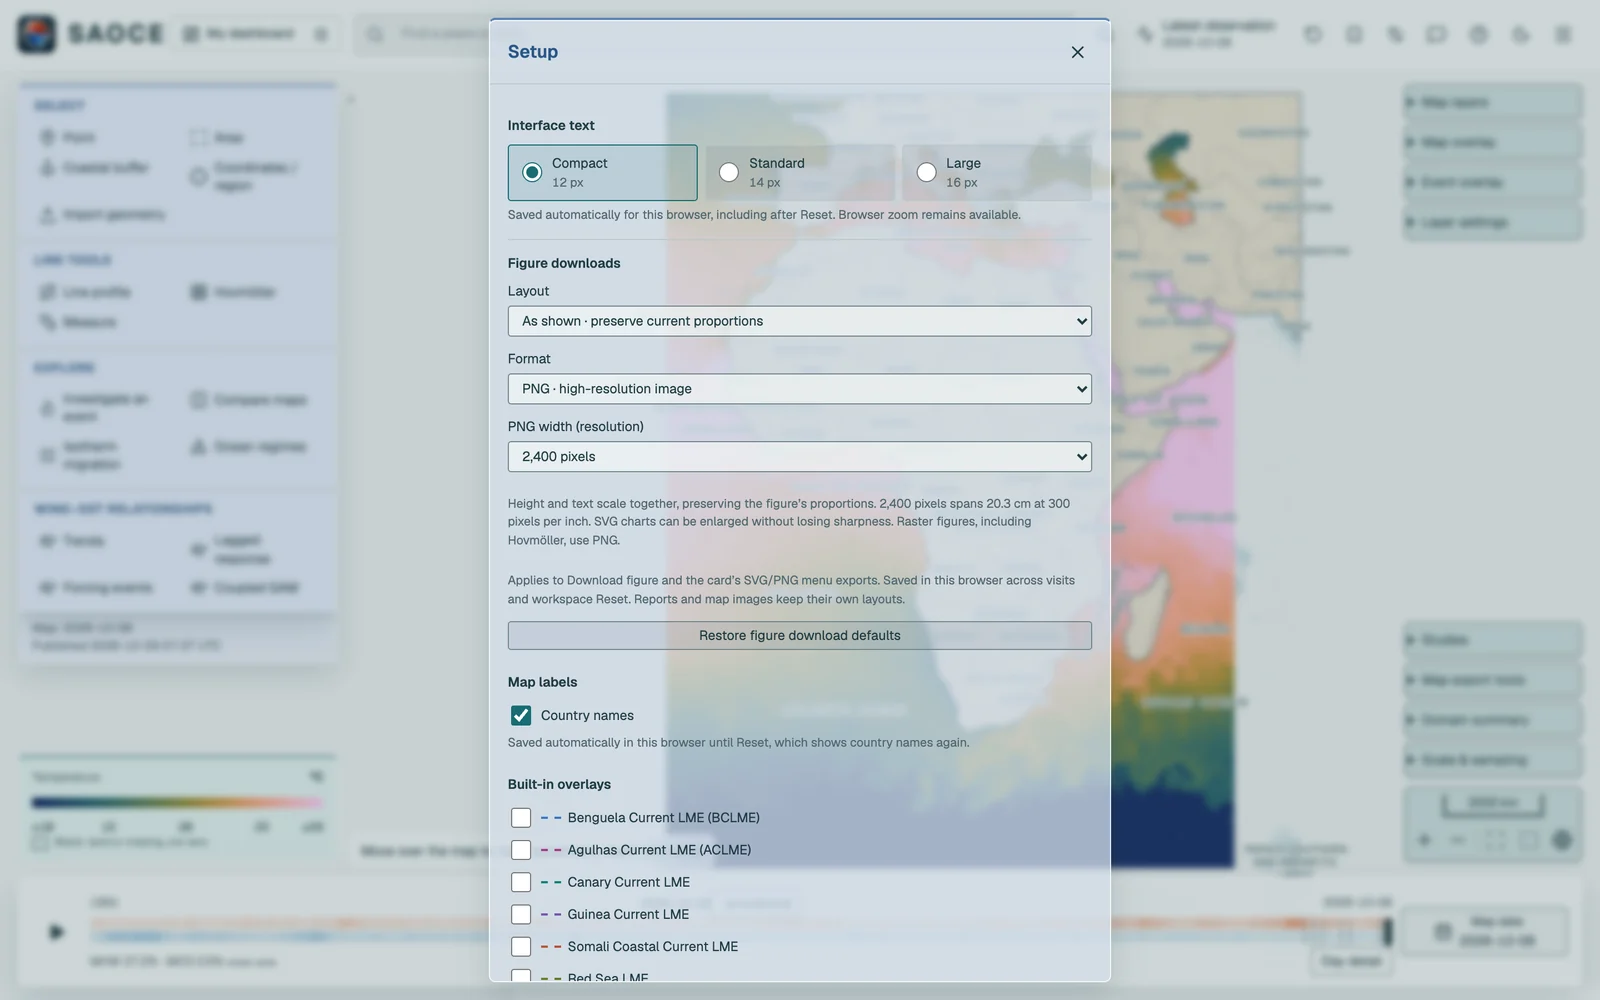
Setup (File → Text size and personal overlays) chooses the interface text size (Compact, Standard or Large), the built-in boundary and grid overlays drawn on the map, and the geometries you have imported for reuse. The preference is saved in the browser and follows you between the map, Help and the operations page.
Your dashboard and one workspace
In Setup, under Map labels, Country names shows or hides the country labels. This choice is saved automatically across visits until Reset, which restores visible country names. It is separate from the built-in overlay defaults.
A plain visit opens your dashboard once the map is ready: either the analysis you saved as home, or the default Benguela example: one area, one docked card and its seasonal cycle. The first-visit Quick start guide explains this example, map navigation, products, dates and how to replace it with your own selections. File → My dashboardreturns to it at any time; work you have not saved is kept under Pin and compare studies on the way out. File → Edit dashboard opens the Dashboard sheet, where you order the cards, choose up to three figures for each, pick the layout and the dates to use on return, and save the result as home. Any saved analysis can also be made the dashboard under Saved work, and Use the default restores the Benguela example.
There is one workspace. Selections are made from the Select menu: Point (click up to four ocean points), Area (draw two corners), Coastal buffer, Coordinates / region and Import geometry. The same menu holds the line tools. Tools that are not selections sit with their questions: Investigate an event (switch to the heatwave layer and click points for event analyses) under Extremes, Compare maps and dates under Compare and Isotherm migration under Change. Studies is under Help, and the map export tools, Domain summary and Scale & sampling under File and Layers. These open as panels in the left column, one at a time; a panel’s title bar closes it. Up to four selections of any mix are open at once, each a card with the full method menu, and every card can carry up to three figures: choose + Figure beside the card’s method to add a second or third. Completed work is kept while you explore and is saved under Saved work.
| Tool | Selection | Result |
|---|---|---|
| Point | One click; 1, 4 or 16 native pixels | A linked card with every method |
| Area | Two opposite corners of a rectangle | A linked card, area-weighted over the ocean cells |
| Coastal buffer | Start and end of a coastal stretch, then an offshore width | A linked card, area-weighted over the buffer |
| Coordinates / region | Typed coordinates, a reporting region, a saved region or a shapefile | The same cards, from exact geometry |
| Import geometry | A GeoJSON, WKT or zipped shapefile | A previewed, saved geometry for analysis or overlay |
| Line profile | Start and end of a line | A line card: values of the displayed map along the line |
| Hovmöller | Start and end of a section | A line card: SST or anomaly through time along the route |
| Measure | Two points | A line card: great-circle distance |
| Isotherm migration | A month and a temperature | Contours of the monthly mean across years |
Result cards share one width. Drag the handle at the bottom to change their height, or focus it and use Up/Down (Shift for larger steps); Home restores the default height. Hovmöller sections initially show the whole diagram and legend, with route and date controls under Section settings.
Every completed card has Details, tables and downloads, organised into selection and dates, method and source, coverage and limitations, statistics and tables, and downloads. The smaller explanatory text and download buttons use one style throughout.
Map layers, legend and layer settings
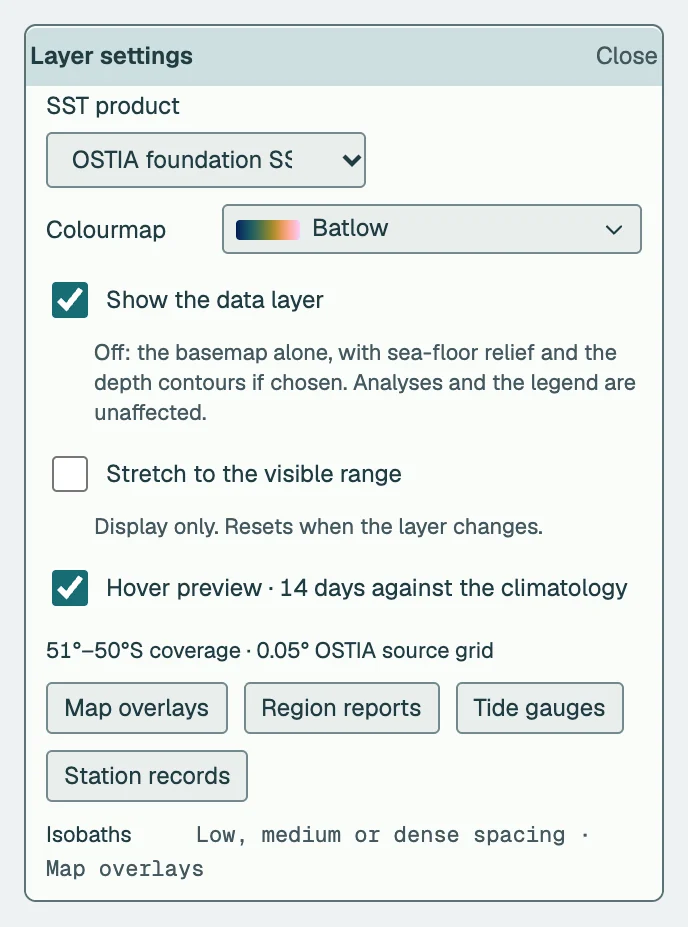
The Layers menu lists the nine layers, the displayed one ticked. Below them, Product and layer settings, Map overlay and Event overlay open as panels in the left column, one at a time. Map overlay adds ERA5 wind vectors over SST without adding another raster; its dated speed key stays with the map legend. Arrows point downwind. The displayed layer’s legend sits at the foot of the left column, with its fixed limits and the note that blank cells are land or missing data, never zero. The Event overlay menu stays visible on every layer and during comparison. When unavailable, it explains how to return to a supported map. Event overlay adds one MHW or MCS category overlay with an opacity slider on the Temperature and SST anomaly layers; its legend expands upward with the temperature or anomaly legend and remains visible when the controls are collapsed. Layer settings (Layers → Product and layer settings) holds the SST product, the colourmap dropdown, with each ramp and name on one line, Stretch to the visible range, the 14-day hover preview, the coverage note, Map overlays (which opens Setup) and Region reports. Layers → Domain summary reports the map date, the publication time and the domain statistics of the displayed layer.

- 1Category map and opacity.
- 2Overlay legend for the same date.
Result cards
Every selection opens a compact floating card beside the map, linked to its marker by a line. The header shows the card identifier (P1, P2, …), the location or label, the Graph options menu (three dots), and the collapse, expand and close buttons. Below it the question, the method and pixel-support selectors, the shared analysis interval and units, the figure, and a footer that switches between Figure and Table and states the observed days and their coverage. Dragging the header moves the card; the arrow keys move it when the header has focus. Expanding a card puts the outcome sentence first, then the figure with its selectable additional figures and display layers, then the method settings, statistics, source tables and the methods and provenance disclosure. The header stays visible while the card body scrolls. Marine heatwave and cold-spell cards open with selectable event lollipops. Clicking a lollipop replaces the overview with its flame graph in the same viewing area, with Back to events and previous/next navigation. Event list and Find by date provide alternative selection routes. Daily threshold departure is a separate optional plot; overlay is an explicit choice. Enlarging a card gives it more figure space without hiding the other cards, and selecting a map marker restores and focuses its card. Line tools use the same width, initial height and header actions as point cards. Hovmöller diagrams gain height when their card is enlarged or resized.

- 1Outcome sentence: the finding with its estimate and uncertainty.
- 2The figure, with its legend layers and the method's additional figures.
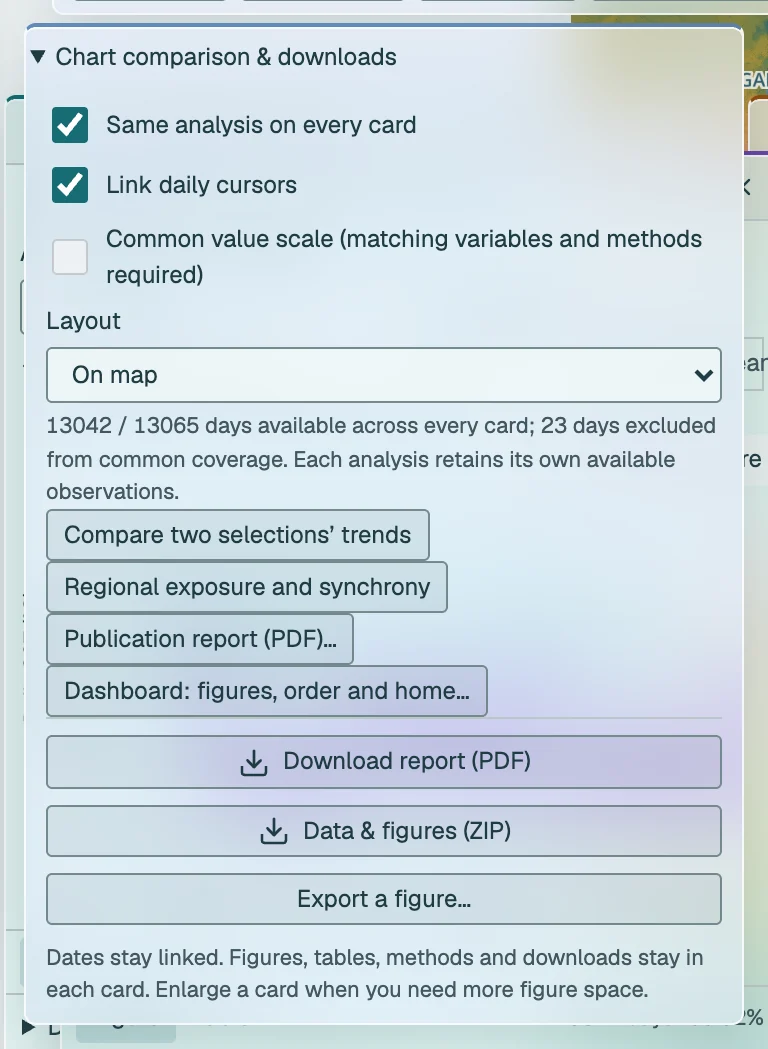
The date pane at the top of the left column sets the analysis interval shared by the point, area and buffer cards (Apply dates, Full record) and holds Save analysis. Below it, Chart comparison & downloads opens over the map with the paired trend comparison and the publication report, without moving the cards. The Cards menu offers Arrange cards, Minimise all, Dock cards and Close all cards. Arrange, Minimise all / Restore, Dock cards and the chart workspace also include up to four Hovmöller cards, alongside the line-profile or measurement card. Hovmöller cards have their own four-card allowance and labelled routes; closing one frees a slot. These tools keep their own dates and settings. Docked cards fill the right column; floating cards stay clear of the left column. Layout changes preserve card settings, heights and completed calculations. Clearing or replacing a selection keeps one previous workspace, and the status bar then offers Undo. Each completed configuration is also written to the browser address, so Back, Forward and a refresh return to a completed result.
Moving around the map
Drag to pan and use the ordinary mouse wheel over the map, or pinch, to zoom towards the pointer. No modifier key is needed. Over a calendar plot the wheel zooms that timeline; over card text it scrolls the card. With the map focused, the arrow keys pan and + and − zoom. The navigation cluster at the right end of the bottom dock adds zoom buttons and three framings a reader moves between: Zoom to selection frames the current point, area, strip, line or section; Reporting area frames the area the event bar is answering for, when it is not the whole domain; and Whole map extent returns to the complete published domain. The same three jumps are available in command search under Map view. The scale bar above the cluster shows the distance at the current zoom. Changing the map layer or date keeps the current view. Layers → Scale and sampling → Explore African basemap shows the wider geographic context around all seven African LMEs. Coastline, relief and depth contours extend beyond the available SST; new visits and the globe button still frame the currently published data.
Cursor values
The cursor bar sits on the legend at the foot of the left column, with the hover preview above it. It labels your exact pointer coordinates as Cursor, alongside depth and the displayed value. Temperature uses the nearest cell in the selected product’s native grid: 0.05° for OSTIA or 0.25° for OISST. Its hover chart labels that cell’s coordinates as Sampled cell centre, which can differ slightly from the cursor position. Both use the same SST cell. Other layers identify their sampling grid in the value tooltip; blank cells are not replaced with offshore neighbours. In Compare maps it reads the side beneath the pointer. The hover preview is on by default: after a short pause over an ocean cell, a small figure shows SST for the map date and preceding seven days at the centre of a monthly section of its 1991–2020 climatology, with the 90th and 10th percentile thresholds and the mean and range of the eight daily values beneath. Hovering creates no card. You can turn the preview off in Layer settings → Hover preview; it is hidden while the map updates and in Compare maps.
Dates and zoom inside a figure
Click anywhere inside a calendar plot to show that date on the map, including blank space between observations. This works for daily and monthly series, calendar-year plots, event histories and Hovmöller diagrams. The active daily map layer and SST product stay selected. If the current layer represents a fixed period, such as SST Trend, the map changes to daily SST with a notice. An unavailable date leaves the previous complete map visible.
Scroll over the plotting area to zoom around the date beneath the pointer. Near the centre both ends change; near the left edge the left date stays anchored while the right end moves, and vice versa. Scroll down to zoom out and up to zoom in. Focus a plot and press + or − to zoom from its centre; Home restores all linked plots to their full records. Browser zoom remains available with Ctrl or Command. Outside the plot, the wheel scrolls the card as usual.
Drag the plot with the hand pointer to move the visible window left or right. Calendar timelines on other cards follow the same dates, including Hovmöllers. A shorter record shows the available overlap and a notice; a record outside the linked dates keeps its previous window with a notice. Navigation does not refit trends or change analysis dates. Seasonal day-of-year, lag, distance and categorical axes are not absolute dates. Use the analysis-period controls to change the scientific interval. Date inputs remain the keyboard alternative for choosing a map day.
SST and anomaly timelines show the selected product’s 1991–2020 climatology and 90th/10th percentile thresholds when the visible window is five years or less. The reference is loaded once for the same selection and data revision, then reused while navigating. On anomaly plots the climatology is zero and both thresholds are departures from it, in °C. Missing reference dates remain gaps. Zooming out hides these lines. Plotted-data exports include the displayed reference values and their analysis identity.
In Setup, Rivers and estuaries saves a show/hide preference for detailed waterways. Zoom in to inspect small coastal systems; see sources and coverage. NEWS lists daily software changes, separately from data publication dates.
Timeline
The bottom timeline spans the selected product’s retained archive to its latest available day. Its orange and blue ribbons show the daily share of ocean area in heatwave and cold-spell conditions, compressed by taking the maximum within each displayed time bin. They describe spatial footprints, not counts of regional events. Grey marks missing source dates; hatching marks times outside the selected layer’s map availability, and the stable/provisional boundary is shown. Dragging previews a date and releasing loads that map; the arrow keys step by one day; the play button animates. Day detail opens the published days of the current release as buttons, and Map date opens the archive calendar. These controls change the map date without changing the analysis interval of any card.


SAOCE on a phone
On a screen narrower than 700 px the map fills the screen and the same tools are reached from a bar along the bottom. Layers, Select and Cards open those menus as sheets; Analyse holds the six question menus (Conditions, Change, Variability, Extremes, Wind and Compare) under their own headings; More holds File and Help. The date strip above the bar steps through the published days and opens the calendar. Over the map, the legend folds to its colour scale and unfolds with its chevron, and two buttons frame the selection or the whole map; zoom and pan with two fingers.
Analysis cards are one sheet at the foot of the map. Drag its handle, or tap the chevron, to move it between a handle, half the screen and the full screen; the A1 to A4 chips scroll to a card. The dates and Chart comparison & downloads sit at the top of the sheet. Every selection is made by tapping: one tap places a point, two taps place the opposite corners of an area, and the ends of a section or coastal strip are tapped in turn. Hover values are not available on a touch screen; the Day detail and the cards carry the values. Add ?shell=classic to the address for the earlier layout on any screen.
Keyboard and commands
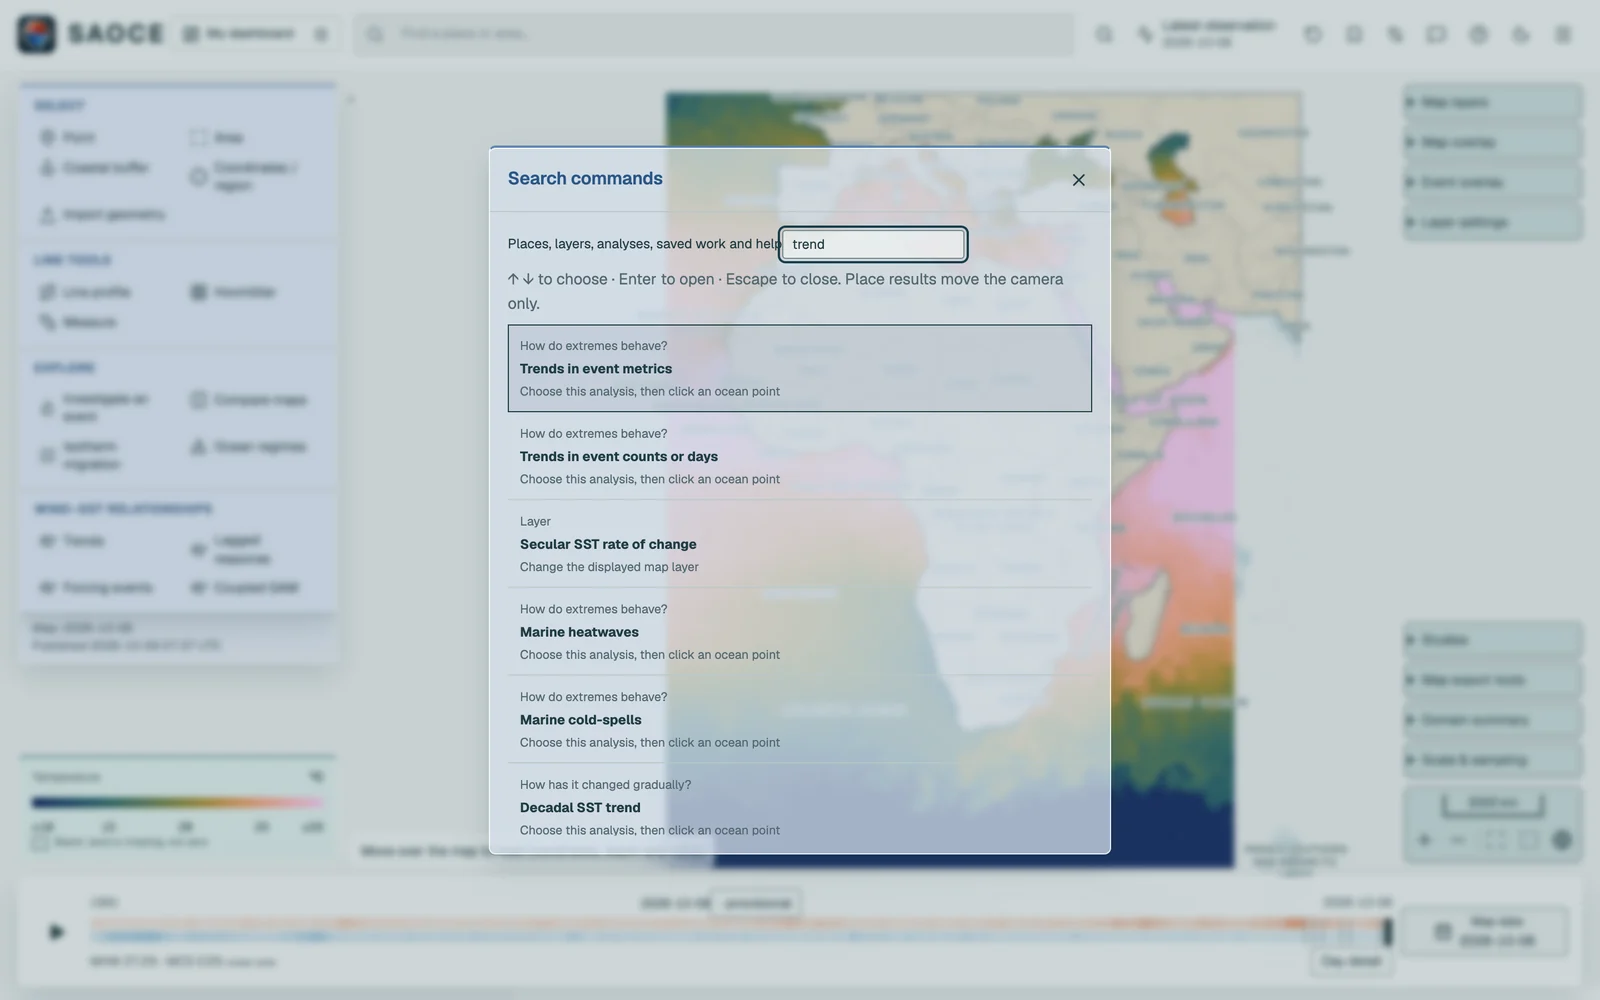
Search commands in the header, or Ctrl/⌘ K, searches places, layers, methods, saved definitions, named views, regions, preserved results and help. Choosing a method applies it to the open cards or prepares it for the next click. Press ? for the shortcut guide, also under Help. Global shortcuts do not run in text fields or dialogues.
- Left and right arrows step the map date through the published days. Space plays or pauses. Neither applies on the event, trend or change layers, or while a control or dialogue has focus.
- Escape closes the innermost open menu, calendar or tooltip first, then the dialogue or card. On the map it cancels a selection in progress.
- When the comparison divider has focus, the arrow keys move it by five per cent and Home and End send it to the edges.
- With a card header focused, the arrow keys move the card; Shift moves it further.
The products behind the layers are described under Map layers; the selections under Selection tools.