
Help and methods · 8
Marine heatwaves and cold-spells
Marine heatwaves (MHWs) and marine cold-spells (MCSs) are detected separately for OSTIA and OISST in the R package heatwave3, with fixed parameters, and every event product in the interface derives from that detection: the category maps and the event overlay, the footprint history under the map, the contiguous patches and tracked blobs of the Top events card, the regional report cards, and the event methods on every selection card.
The active SST product determines the MHW/MCS maps, event overlays and new event analyses. Existing cards retain their own product. OSTIA and OISST thresholds are computed from their respective 1991–2020 records, not shared across products.
Events on a card
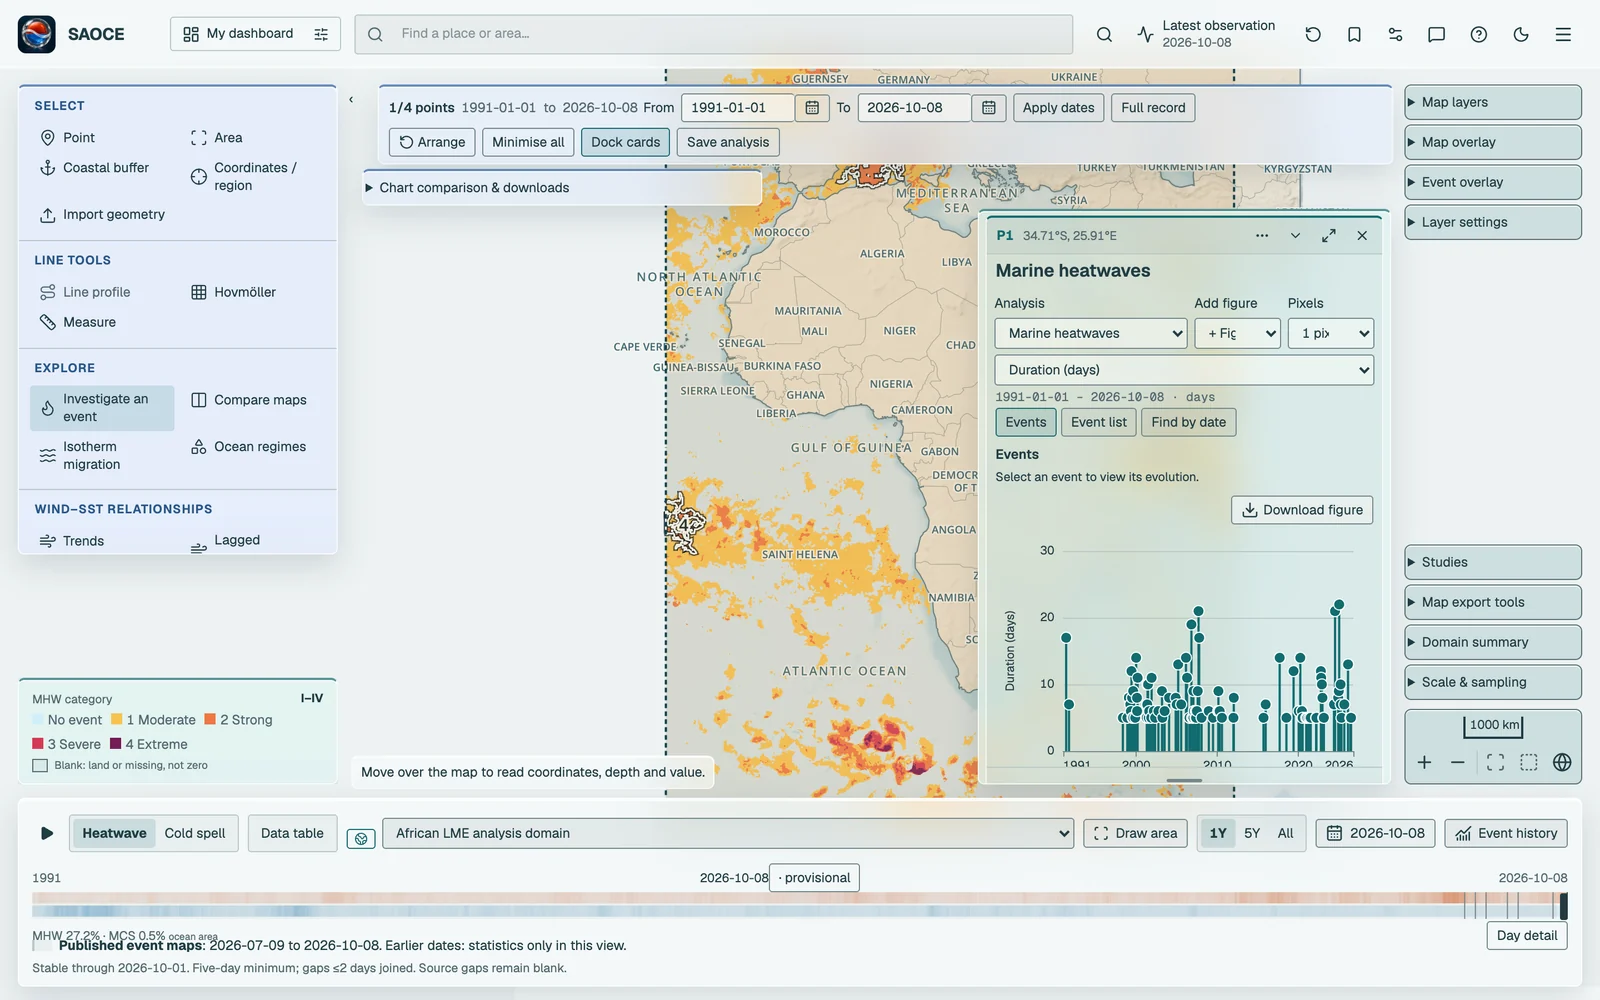
Choose Marine heatwaves or Marine cold-spells under How do extremes behave? on any point, area, buffer or region card, or press Investigate an event under Explore. The Events figure shows one selectable lollipop per detected event, at its peak date, with height given by the chosen metric. Events extending beyond the overview appear as diamonds at the nearest boundary when their peak falls outside it. Their full recorded metrics are retained.
Select a lollipop or a row in Event list to open the event’s flame graph in the main figure area. Back to events, Previous event and Next event let you browse without changing the shared analysis interval. Find by date accepts start and end dates or lets you drag across the overview. One overlapping event opens directly; several matches appear in the event list; an empty selection offers SST and threshold context. Short overviews keep the lollipops.
Show daily threshold departure adds a separate plot aligned to the event timeline. Overlay plots combines the two only when selected. Positive departure means SST above the heat threshold or below the cold threshold; individual exceedance days need not form a detected event. Compare top three events opens the largest three by the selected metric’s magnitude. Duration, intensity, category and provisional-status filters are in the event list. Event-metric and event-count trends use the same detections; see Statistical methods.
The detection
The definition follows Hobday et al. (2016). For each cell, or for a regional-mean series, a day-of-year climatology and a percentile threshold are computed over 1991–2020 with an 11-day window (half-width 5) and the threshold is smoothed with a 31-day running mean. A heatwave is a run of at least five consecutive days above the 90th percentile; a cold-spell is a run of at least five days below the 10th percentile. Two runs separated by a gap of at most two days are joined into one event. The baseline is not detrended, and no missing day is padded: the padding length is fixed at zero, and a run broken by a missing day ends there.
| Parameter | Value |
|---|---|
| Climatology period | 1 January 1991 to 31 December 2020, separately for each SST product; OSTIA uses its reprocessed record |
| Percentile | 90 (heatwaves), 10 (cold-spells) |
| Window half-width | 5 days |
| Threshold smoothing | 31-day running mean |
| Detrending | None |
| Minimum duration | 5 days |
| Maximum joined gap | 2 days |
| Padding of missing days | None (maxPadLength 0) |
| Hemisphere convention | Southern |
Categories follow Hobday et al. (2018) as implemented in heatwave3: the difference between the threshold and the climatology on each day defines one unit, and a day’s category is Moderate (I) when the departure from the climatology exceeds one unit, Strong (II) above two units, Severe (III) above three and Extreme (IV) above four. An event’s category is the highest reached during it. On the maps a category is shown only where an event is active; an isolated exceedance that fails the five-day rule is drawn as no event.
Stable and provisional days
Because an event needs five days and a two-day gap can be bridged, the classification of the last seven days can change as new days arrive. The interface names the last day that can no longer change the stable through date, labels later days provisional, keeps them out of annual summaries, while recent maps are explicitly labelled provisional. The daily update recomputes a 120-day tail against the approved climatology, checks that it reproduces the immutable full-domain result away from the boundary, and replaces any provisional day whose category changed.
The event maps, the overlay and the event bar
The MHW and MCS category layers colour each cell by the category of the event active on that day, and the Event overlay draws the same categories over the temperature or anomaly map at a chosen opacity. Under the map on the event layers, the event bar switches between Heatwave and Cold spell, chooses the reporting region, offers 1Y, 5Y and All ranges for the history chart, opens the data table and the date. The history chart plots two series for the region: the event footprint, i.e. the share of the region’s ocean area in an event, and the share at Strong or greater. The timeline’s ribbons show the same footprints for the whole domain across the archive.

- 1Category legend.
- 2Event bar with layer switch, region, range, table and date.
Contiguous patches and tracked blobs
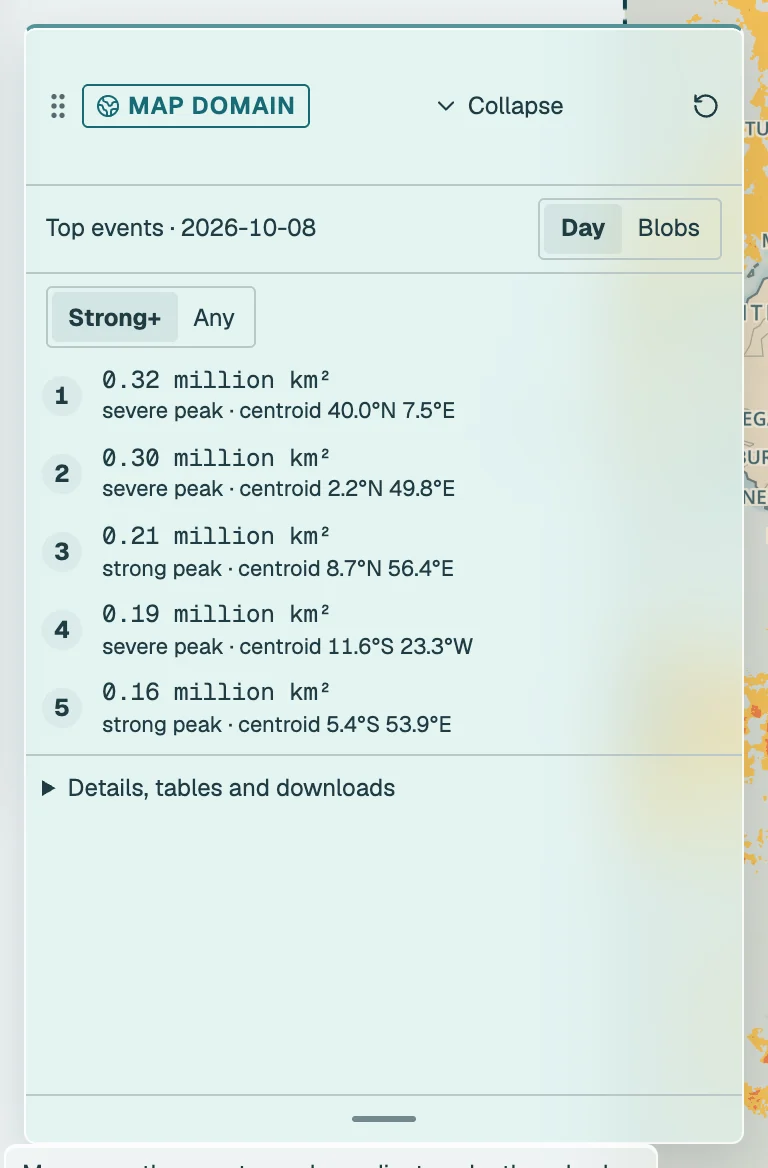
The Top events card on an event layer lists the largest spatial structures. In Day mode these are contiguous patches of the day’s event-masked category field on the selected product’s native grid: cells are connected through their eight neighbours, and the nominal minimum patch area uses 40 OSTIA cells or 2 OISST cells, and the five largest by spherical area are outlined and numbered on the map. Strong+ counts cells of category II or higher; Any counts every active cell. Each patch reports its area, its peak category and its area-weighted centroid.
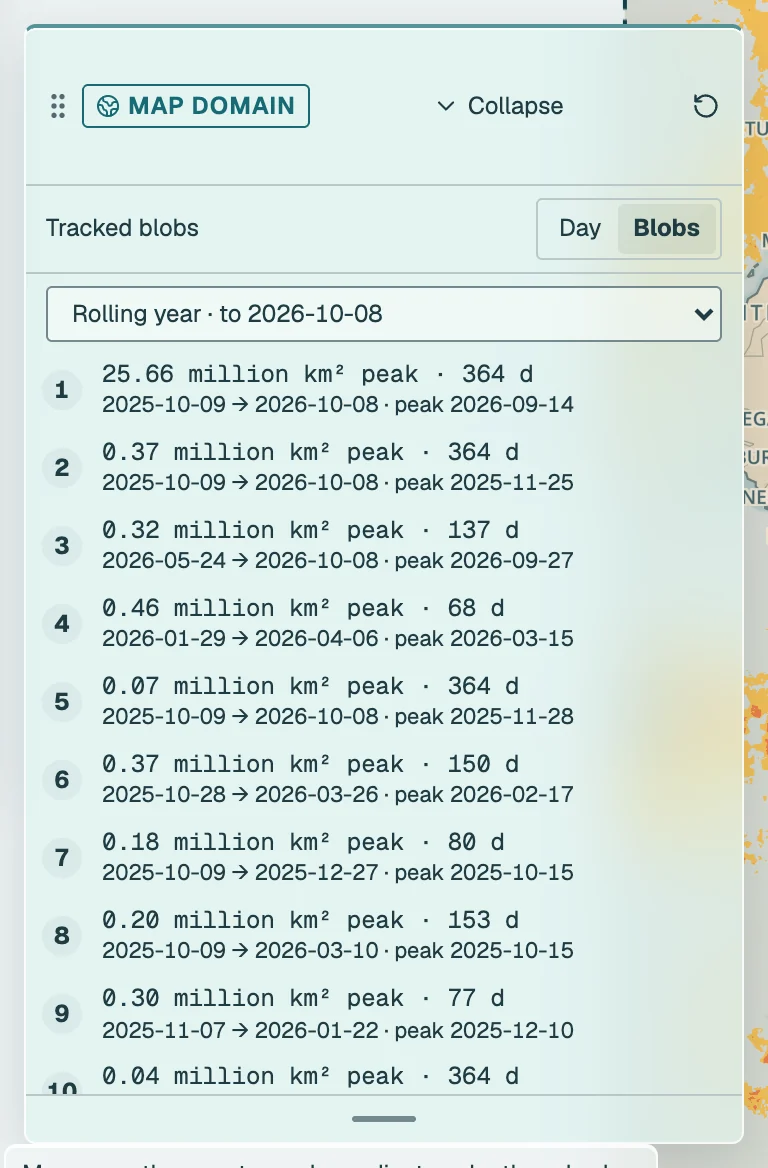
In Blobs mode the card lists events tracked through space and time. The heatwave3 blob detector connects event voxels through their faces in longitude, latitude and time over a window, either a calendar year or the rolling 365 days ending on the latest validated day, keeps blobs of at least 2,000 voxels, and ranks them by cumulative intensity times area. Blobs are cut at the window boundaries and ranked within the window. Each entry gives the peak area, the duration and the start, peak and end dates.
Regional report cards
Region reports, in Layer settings (Layers → Product and layer settings), opens exposure report cards for the seven reporting regions. For heatwaves and for cold-spells separately, a card compares the mean number of event-days per year in the reference decade 1991–2000 with the most recent ten complete stable years, and states the change in days per year. The events are those detected in the area-weighted regional mean SST of the region, so the counts describe the region as one series rather than averaging grid-cell events. Both decade means need all ten years; otherwise the change is withheld and the missing years are listed. No significance is claimed.

References: Hobday, A. J. et al. (2016) A hierarchical approach to defining marine heatwaves. Progress in Oceanography 141, 227–238. Hobday, A. J. et al. (2018) Categorizing and naming marine heatwaves. Oceanography 31, 162–173. Schlegel, R. W. and Smit, A. J. (2018) heatwaveR: a central algorithm for the detection of heatwaves and cold-spells. Journal of Open Source Software 3, 821.